We started out with only the customer’s general idea of a future solution and finalized the project requirements before getting down to designing and developing this custom conference management software.
The resulting solution allows event managers to perform the following activities:
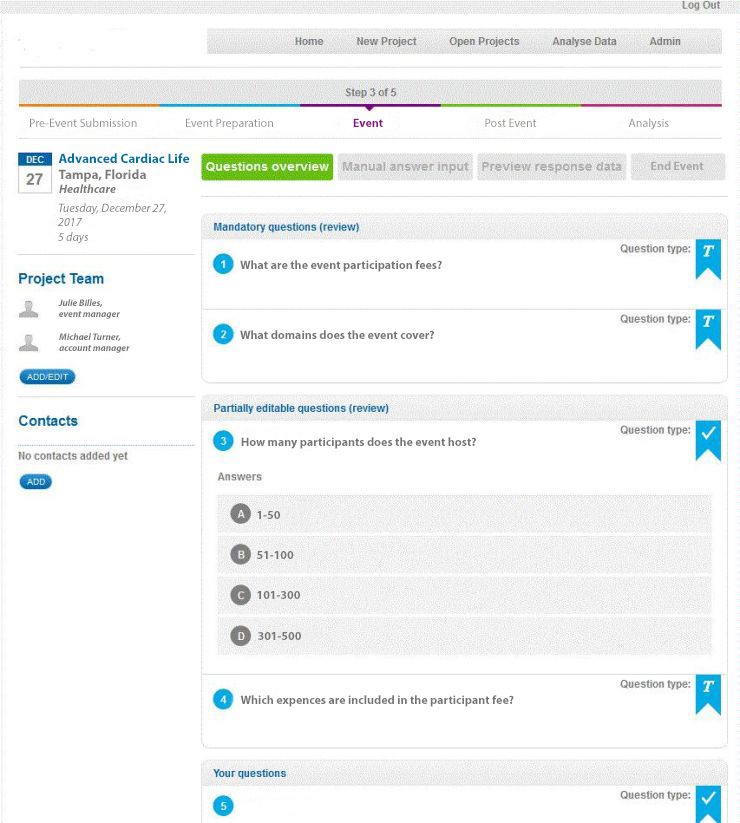
Set up events and update their details. The solution allows event-organizing teams to upload information about an event (date, venue, attendees, program, speakers, etc.) into the system and update these details anytime.
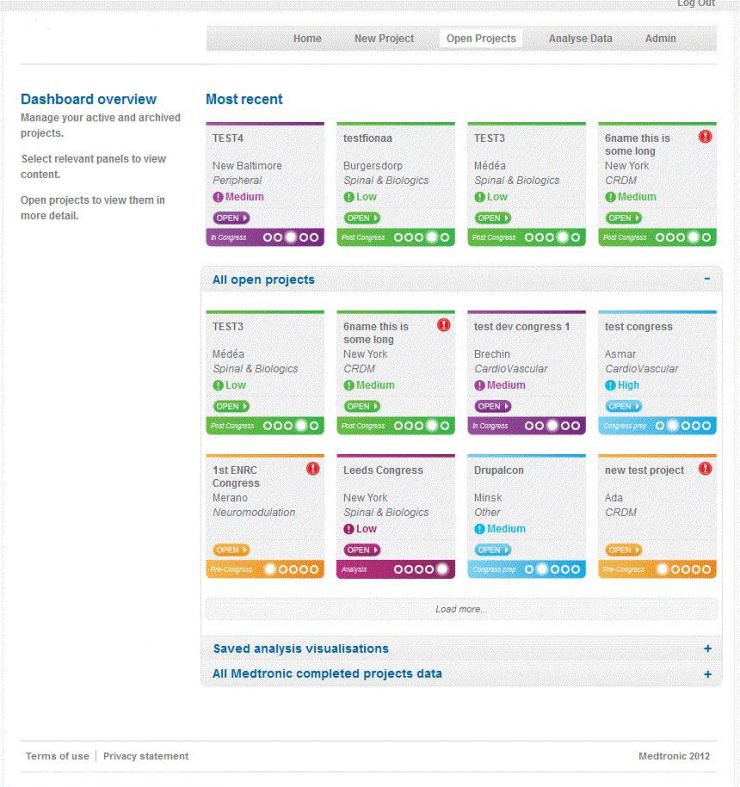
Manage event workflows. The solution is designed to provide managers with complete visibility into step-by-step event management workflows, from early submissions and advertising activities to post-event analysis and reports. This process allows managing not only active projects but also archived ones, compare them, and make well-grounded decisions when planning for future events.
Collect attendees’ feedback. In addition to the core web portal, Iflexion’s team developed an iPad version of the solution for event managers to interview conference participants on the spot. The iOS application can operate both with and without an internet connection. In the latter case, event managers can register attendees’ answers manually during the event; then the answers get automatically uploaded to the server as soon as the device connects to the internet. Once uploaded, the survey results become available for further analysis.
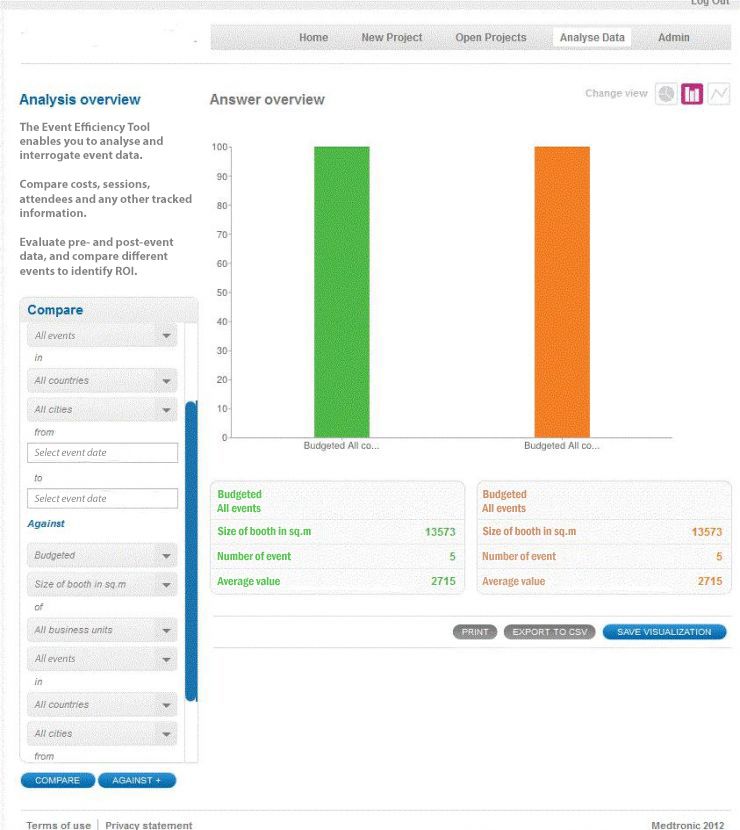
Analyze event data, generate reports, and calculate ROI. The system contains an analytics module for reporting on event performance. It processes various event parameters, including the number of participants, leads and converted customers; venue hire and hospitality expenses; attendee survey results, and more.
Relying on the aggregated data, managers can measure event performance at different stages and compare their profitability with past events. It’s also possible to calculate each event’s ROI to evaluate its overall effectiveness and understand if any optimization is required to increase performance in the future. The system visualizes these analytical results in Excel-like spreadsheets with colored diagrams and charts.


